Stock Sentiment Analysis using Python & Machine Learning
Sentiment analysis using Huggingface transformers Machine Learning Pipeline
Getting started
We will need Python, pandas, numpy, matplotlib, plotly and yfinance (yahoo finance) libraries installed.
Sentiment analysis (or opinion mining) is a natural language processing (NLP) method used to determine whether data is positive, negative or neutral. Sentiment analysis is often performed on textual data to help businesses monitor brand and product sentiment in customer feedback, and understand customer needs. Today we will apply it to the stock market to see if there are any leading or lagging indicators and correlation between sentiment and stock price.
Goals of this Analysis
Scrape historic Stock Prices using Python
Explore Stock history & plotting
Pull speculative social media comments on Stocks
Run Sentiment Analysis on comments using ML
Note: This project is for entertainment and technology educational purposes only and is not financial advice.
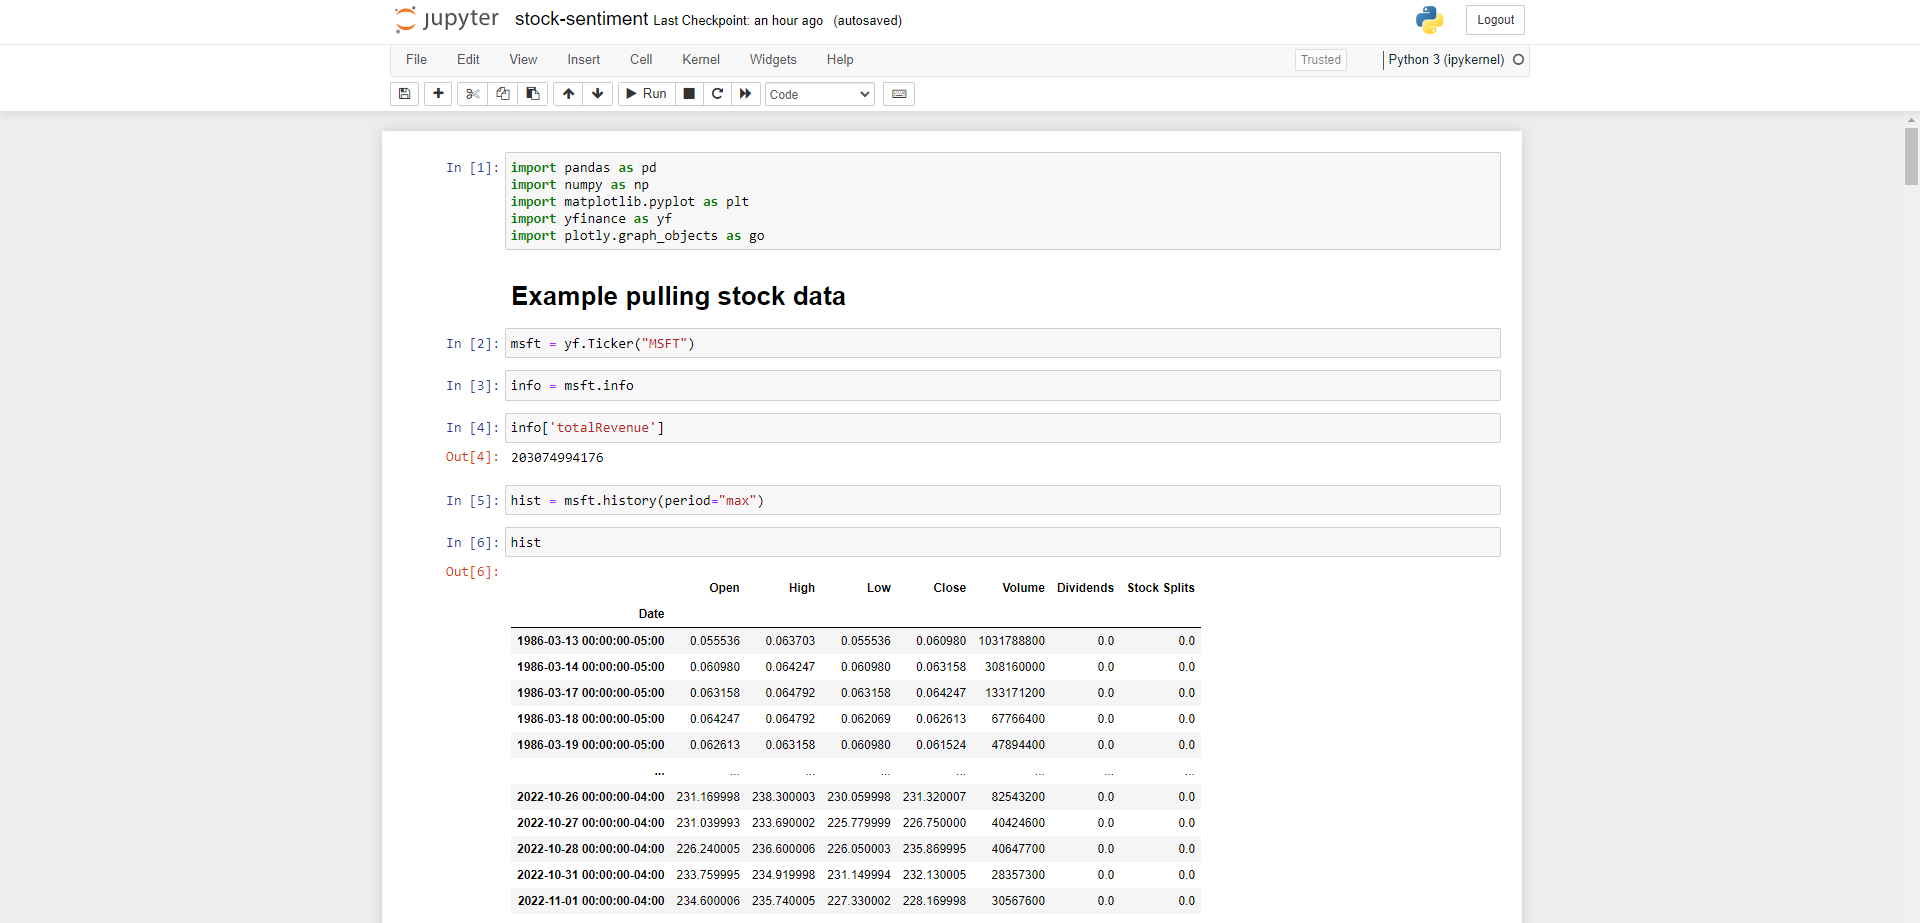
Example: Pulling Microsoft Stock
Start by importing the aforementioned libraries, if you don’t have yfinance you can pip install it from here: https://pypi.org/project/yfinance/
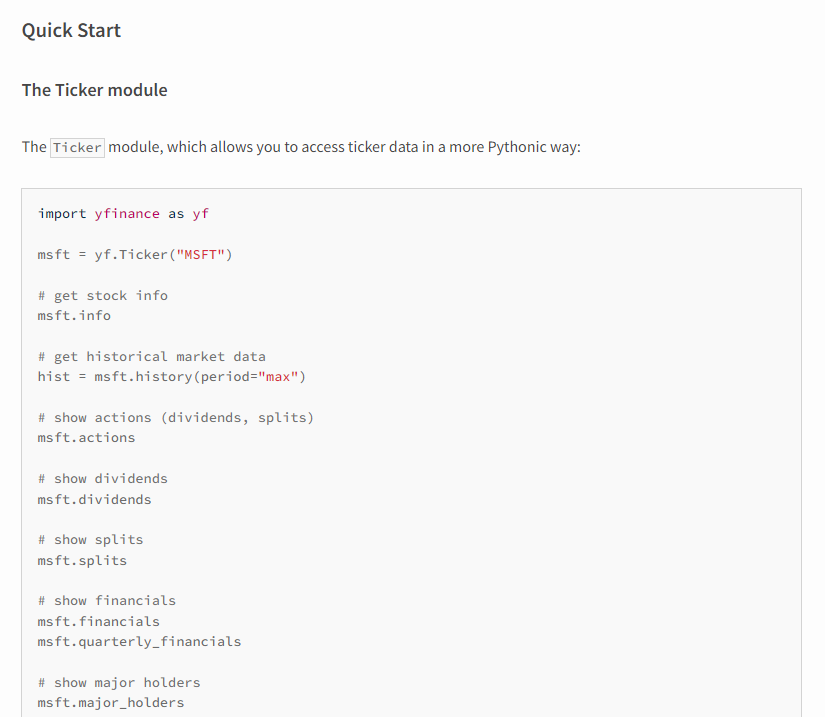
The library is super easy to use, just follow their quickstart guide on the link above to get stock ticker information.
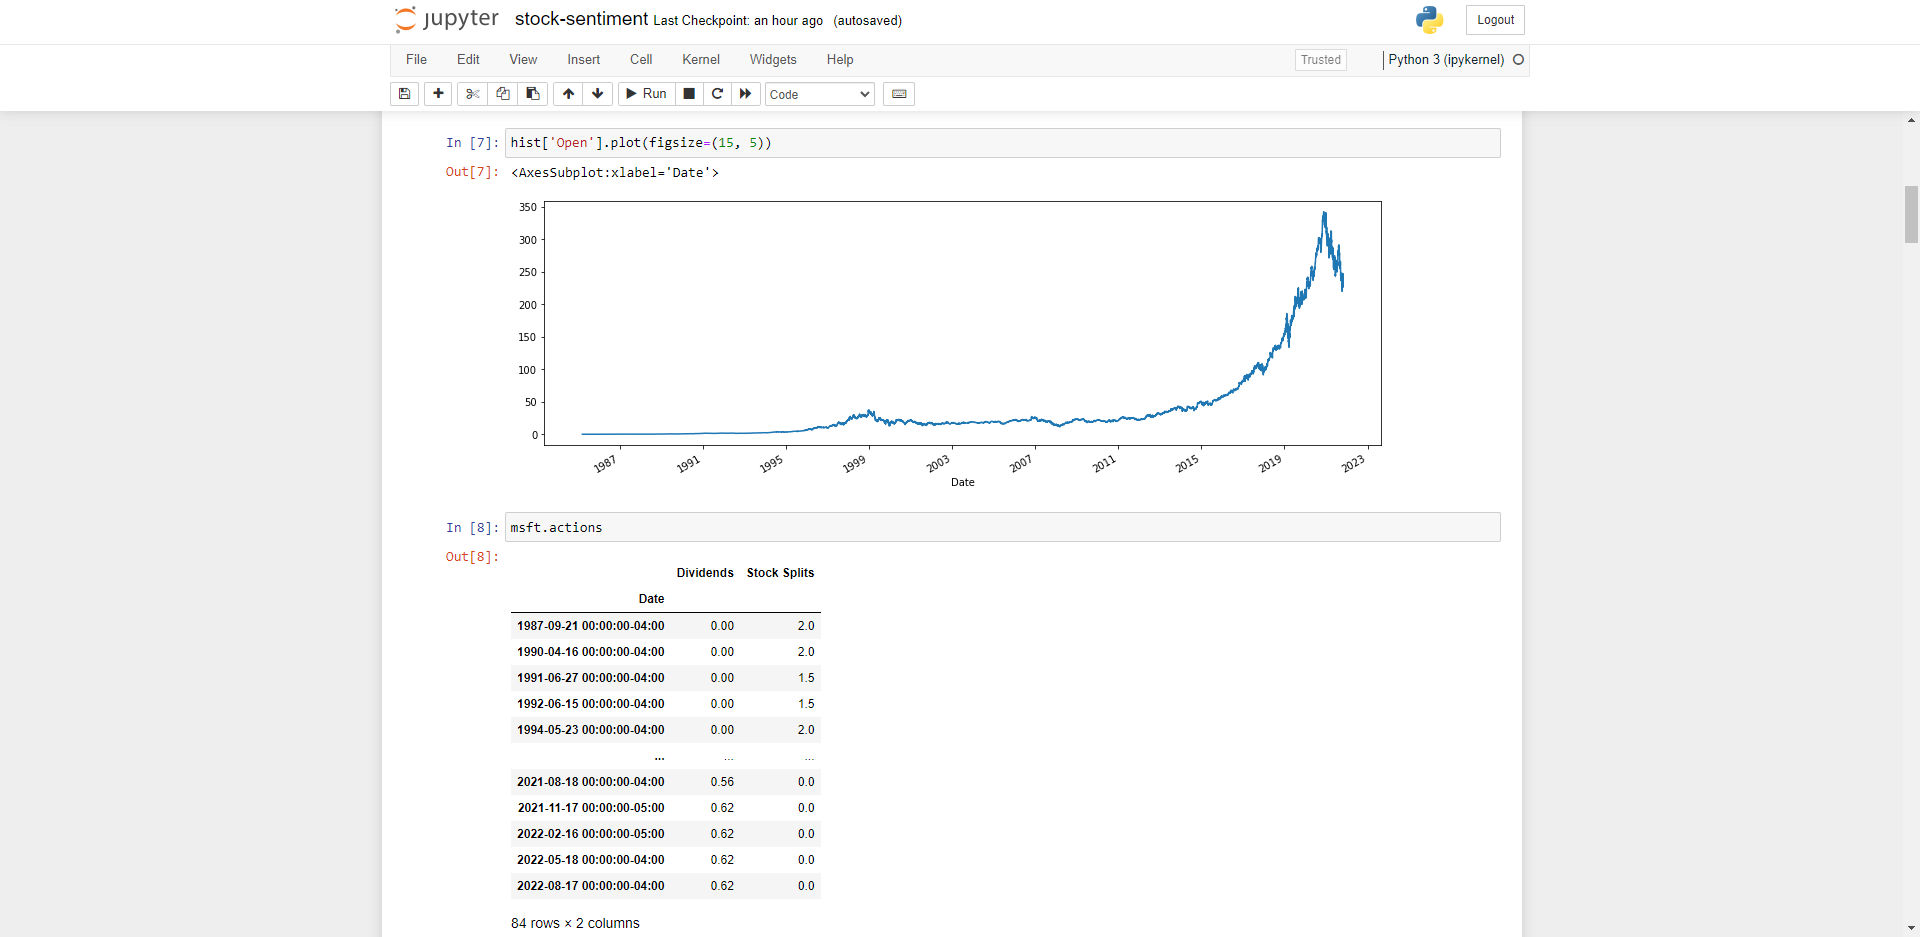
Let’s plot out the Microsoft Share Price using the plot method to visualise historical data.
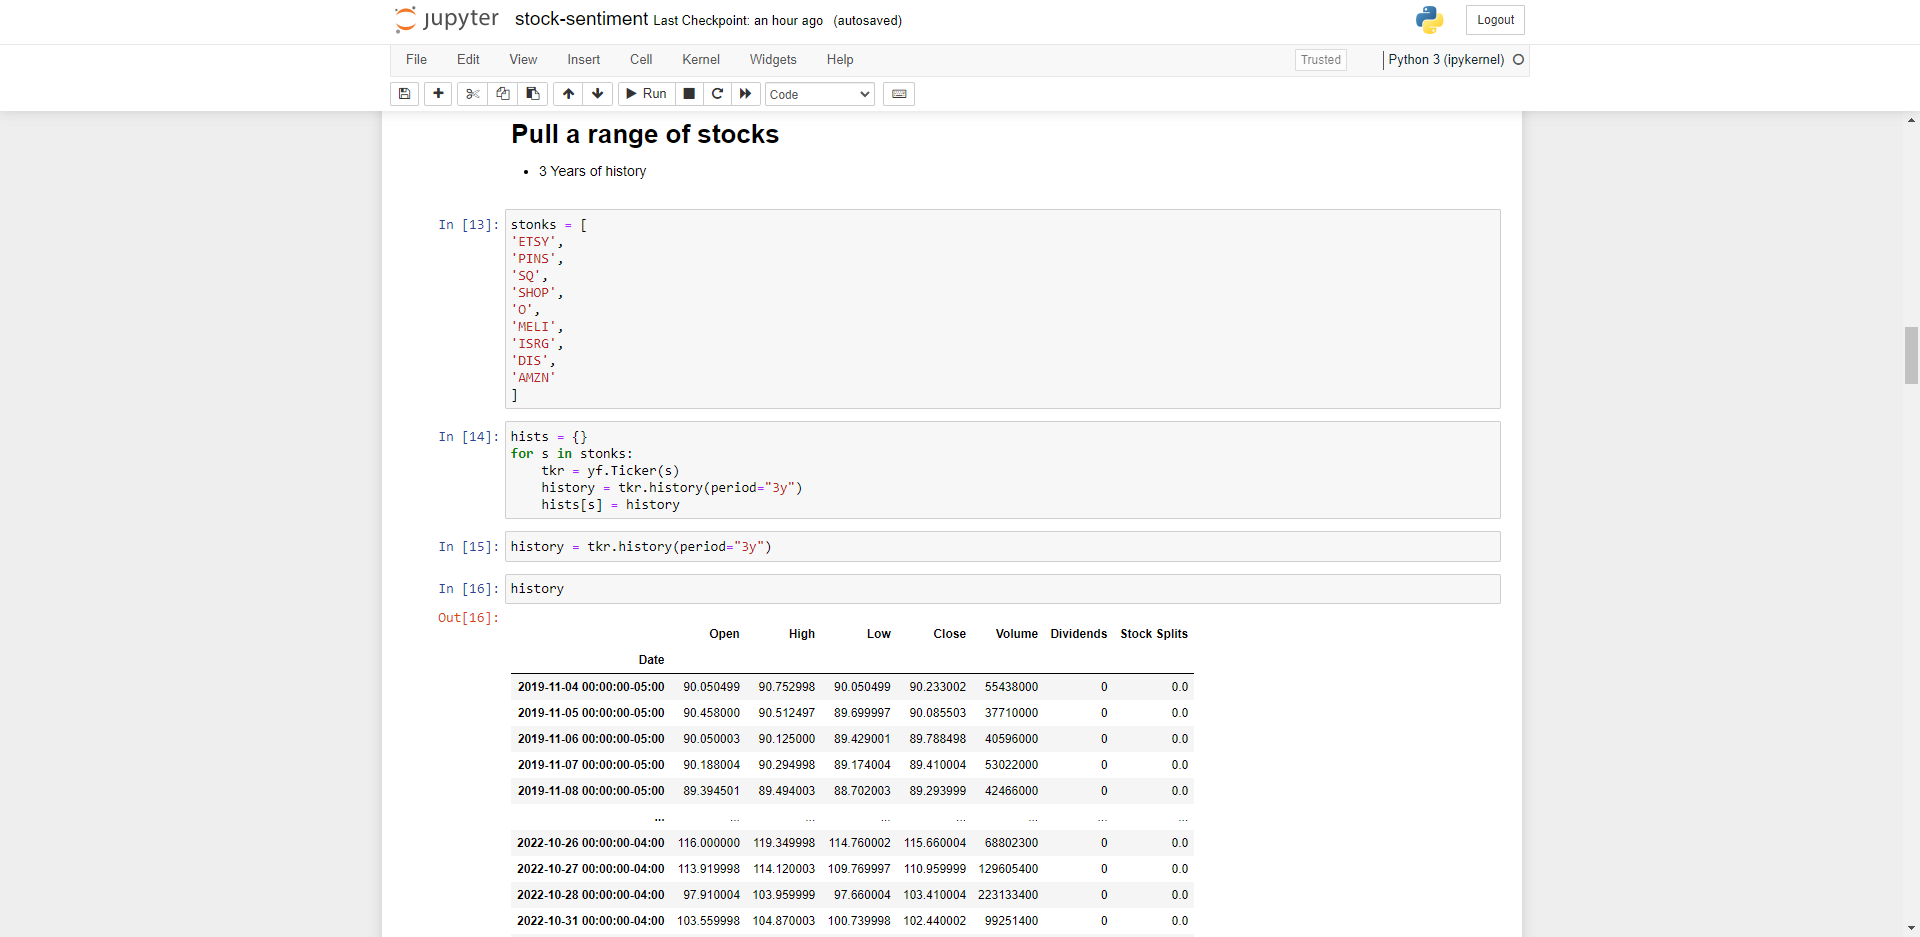
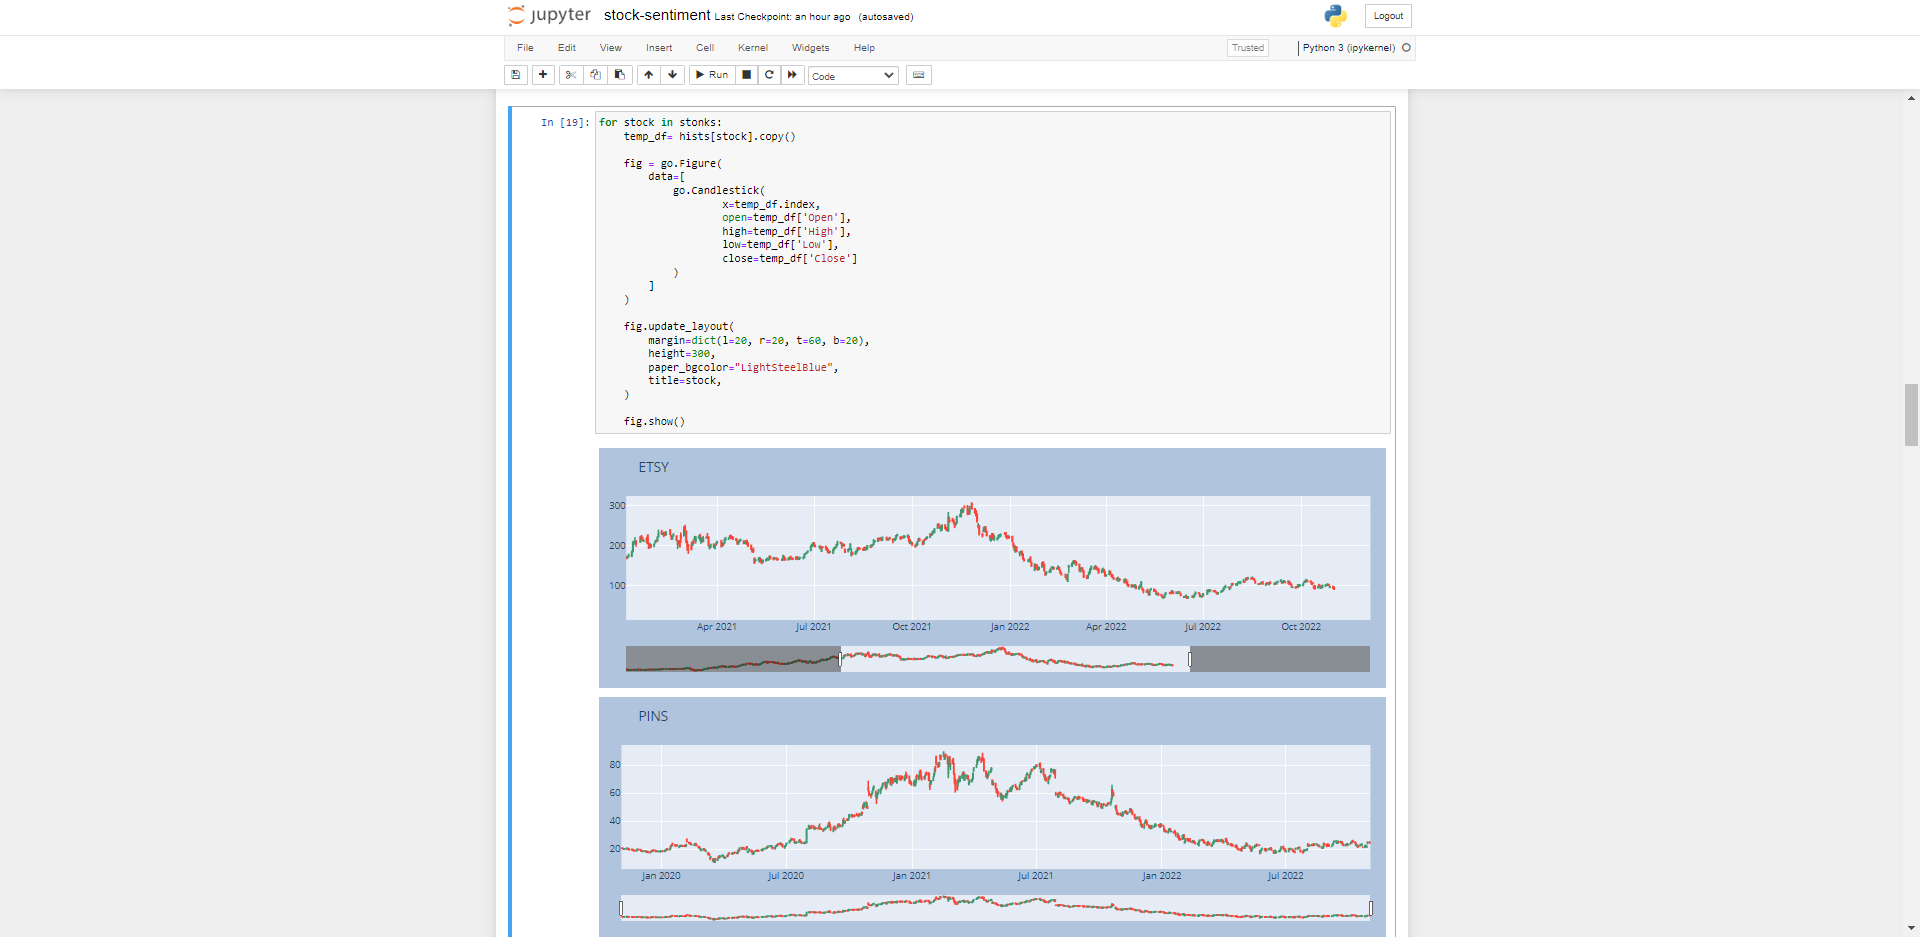
Pulling a range of stocks & Plotting using candlesticks
We can pull in multiple stock information by placing them in a Python list, then iterating through the list.
Iterate through the list of stocks and plot using plotly’s go.candlestick method, more information can be found here on how the candlestick visualisation works: https://plotly.com/python/candlestick-charts/
Pulling Social Media Stock References
There’s a few ways we can pull this information, in another one of my posts I showed using an API, there’s also webscraping tools like Beautiful Soup and a library we’ll use here called snscrape.
The github repository can be found here: https://github.com/JustAnotherArchivist/snscrape
Using this library we can scrape public social media comments for:
Facebook: user profiles, groups, and communities (aka visitor posts)
Instagram: user profiles, hashtags, and locations
Mastodon: user profiles and toots (single or thread)
Reddit: users, subreddits, and searches (via Pushshift)
Telegram: channels
Twitter: users, user profiles, hashtags, searches, tweets (single or surrounding thread), list posts, and trends
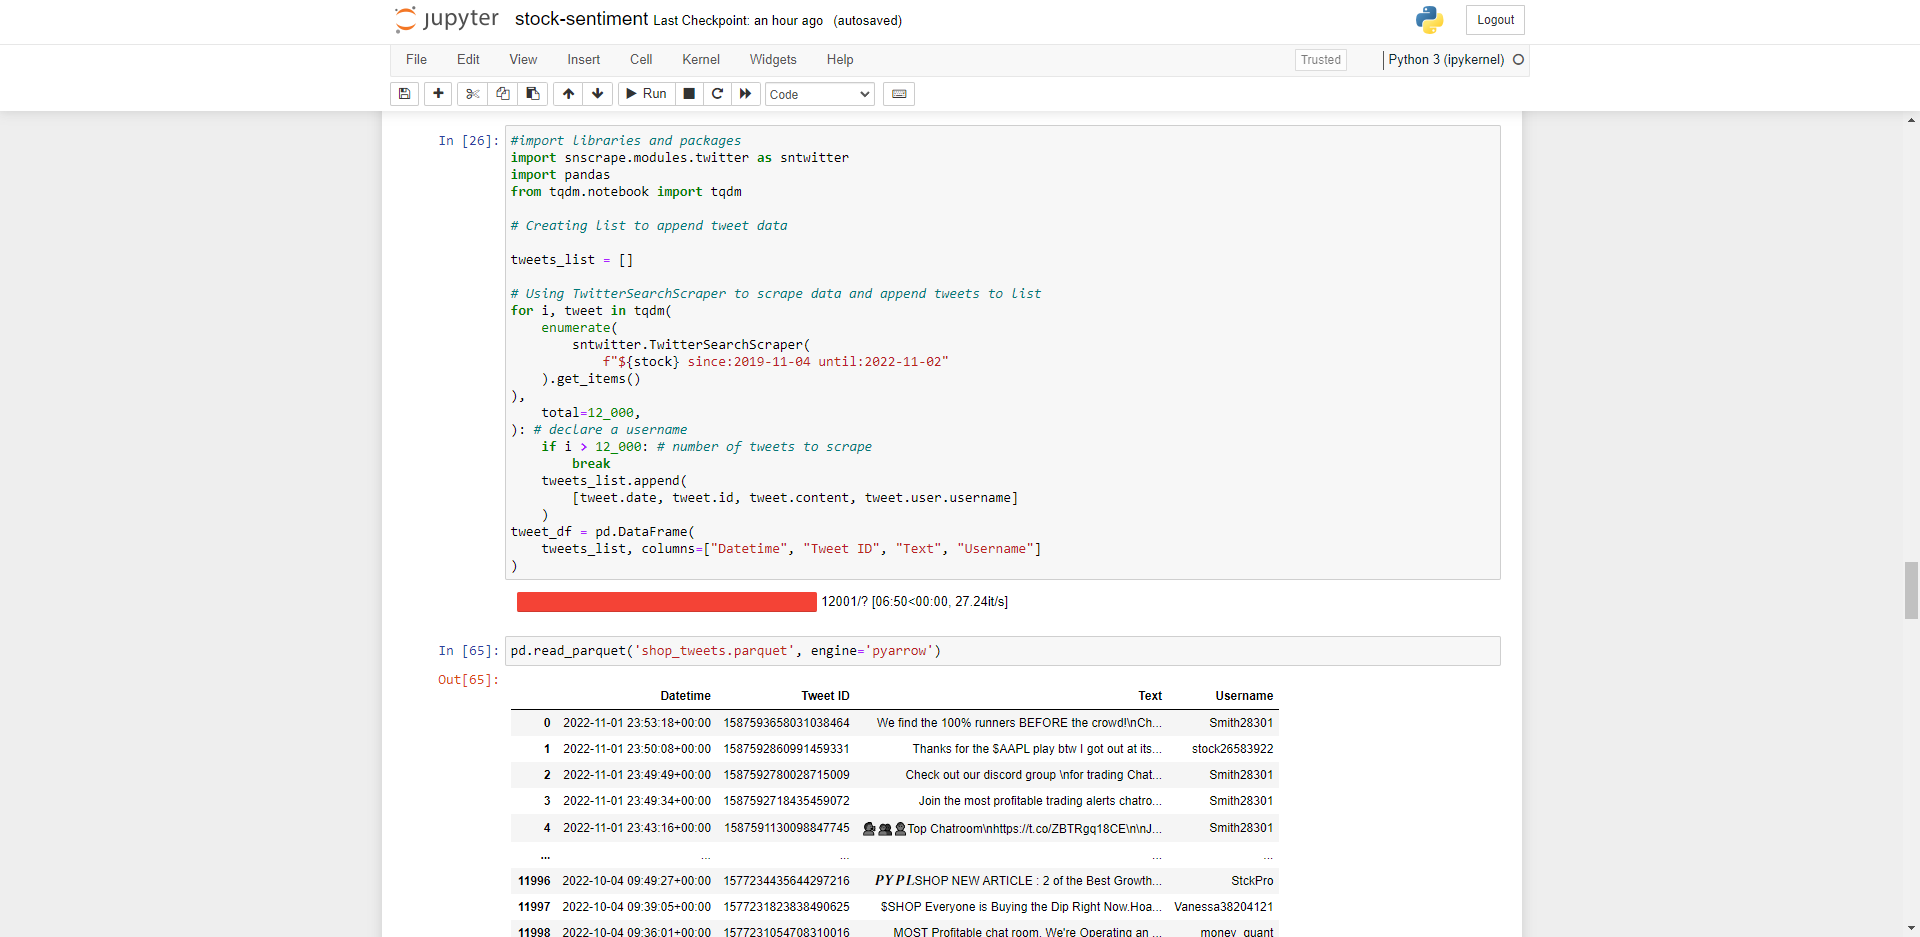
In this example we will be running social sentiment on the company Shopify – ticker $SHOP. Set this as a variable ‘stock’ then import snscrape. This is quite a lot of information to hold in memory so I’ll save to disk using pyarrow which can be installed from: https://arrow.apache.org/docs/python/install.html#using-pip
tweet_df.to_parquet("shop_tweets.parquet")
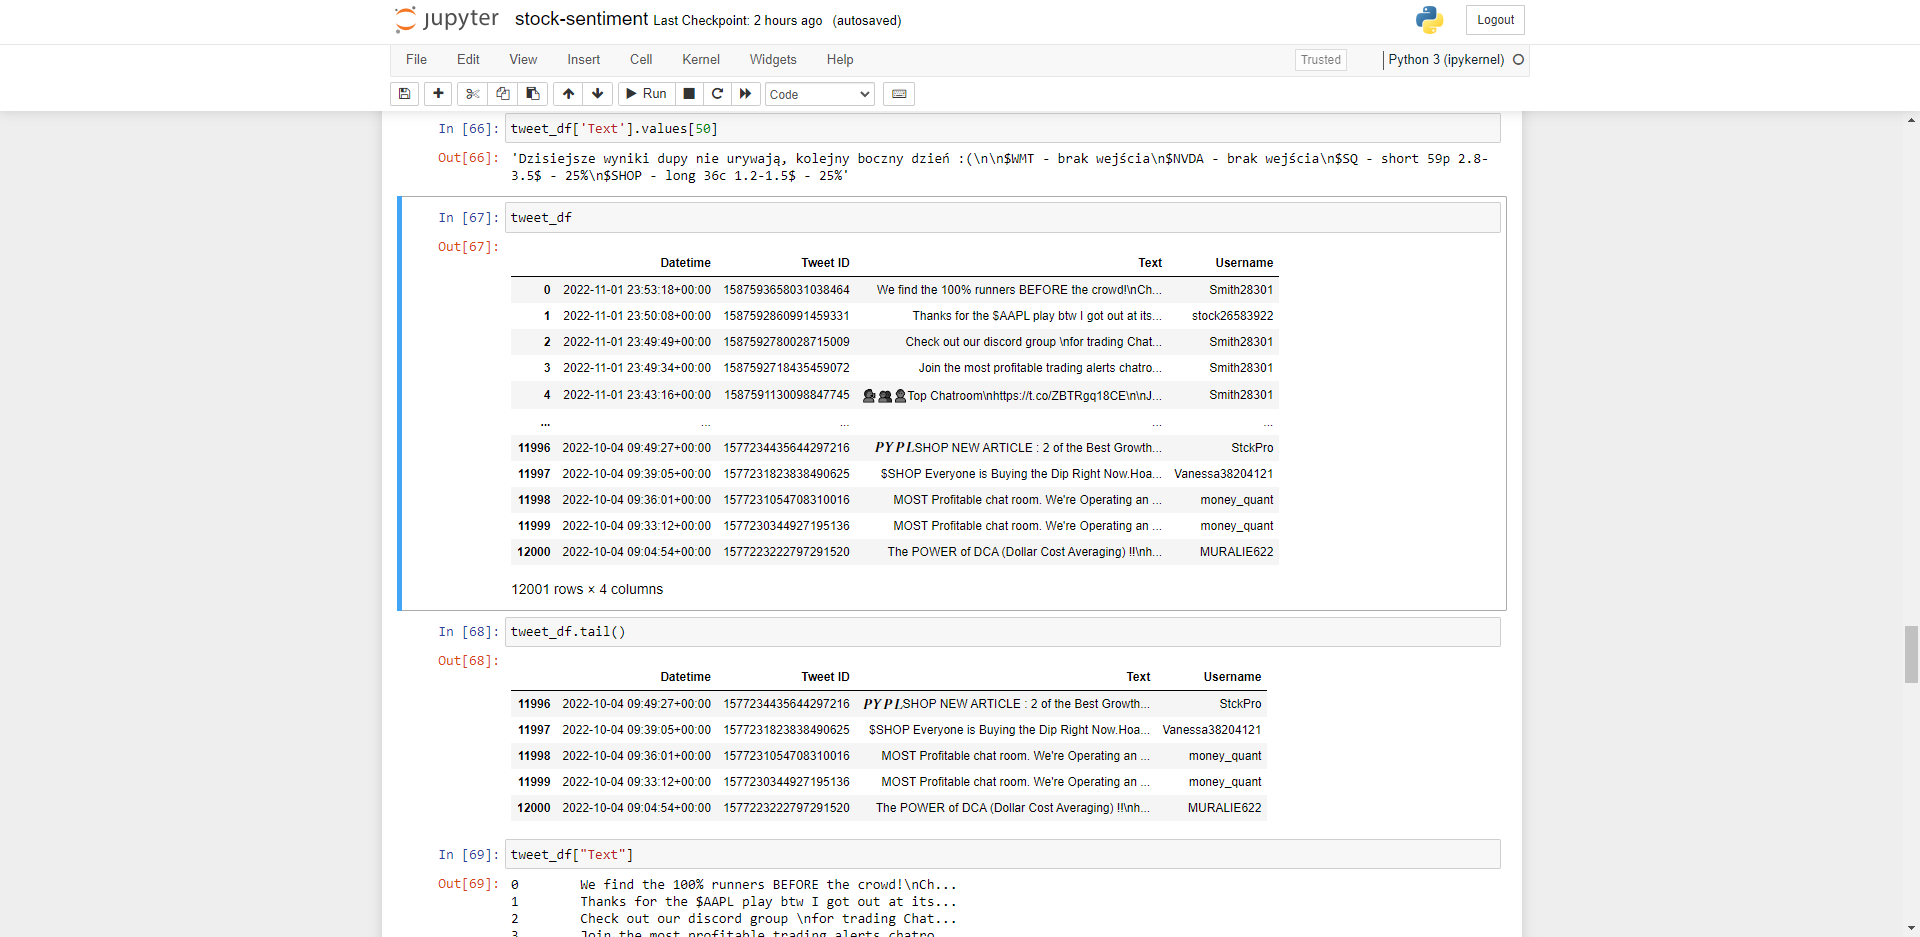
Run some basic Pandas Dataframes functions to explore the dataset imported correctly.
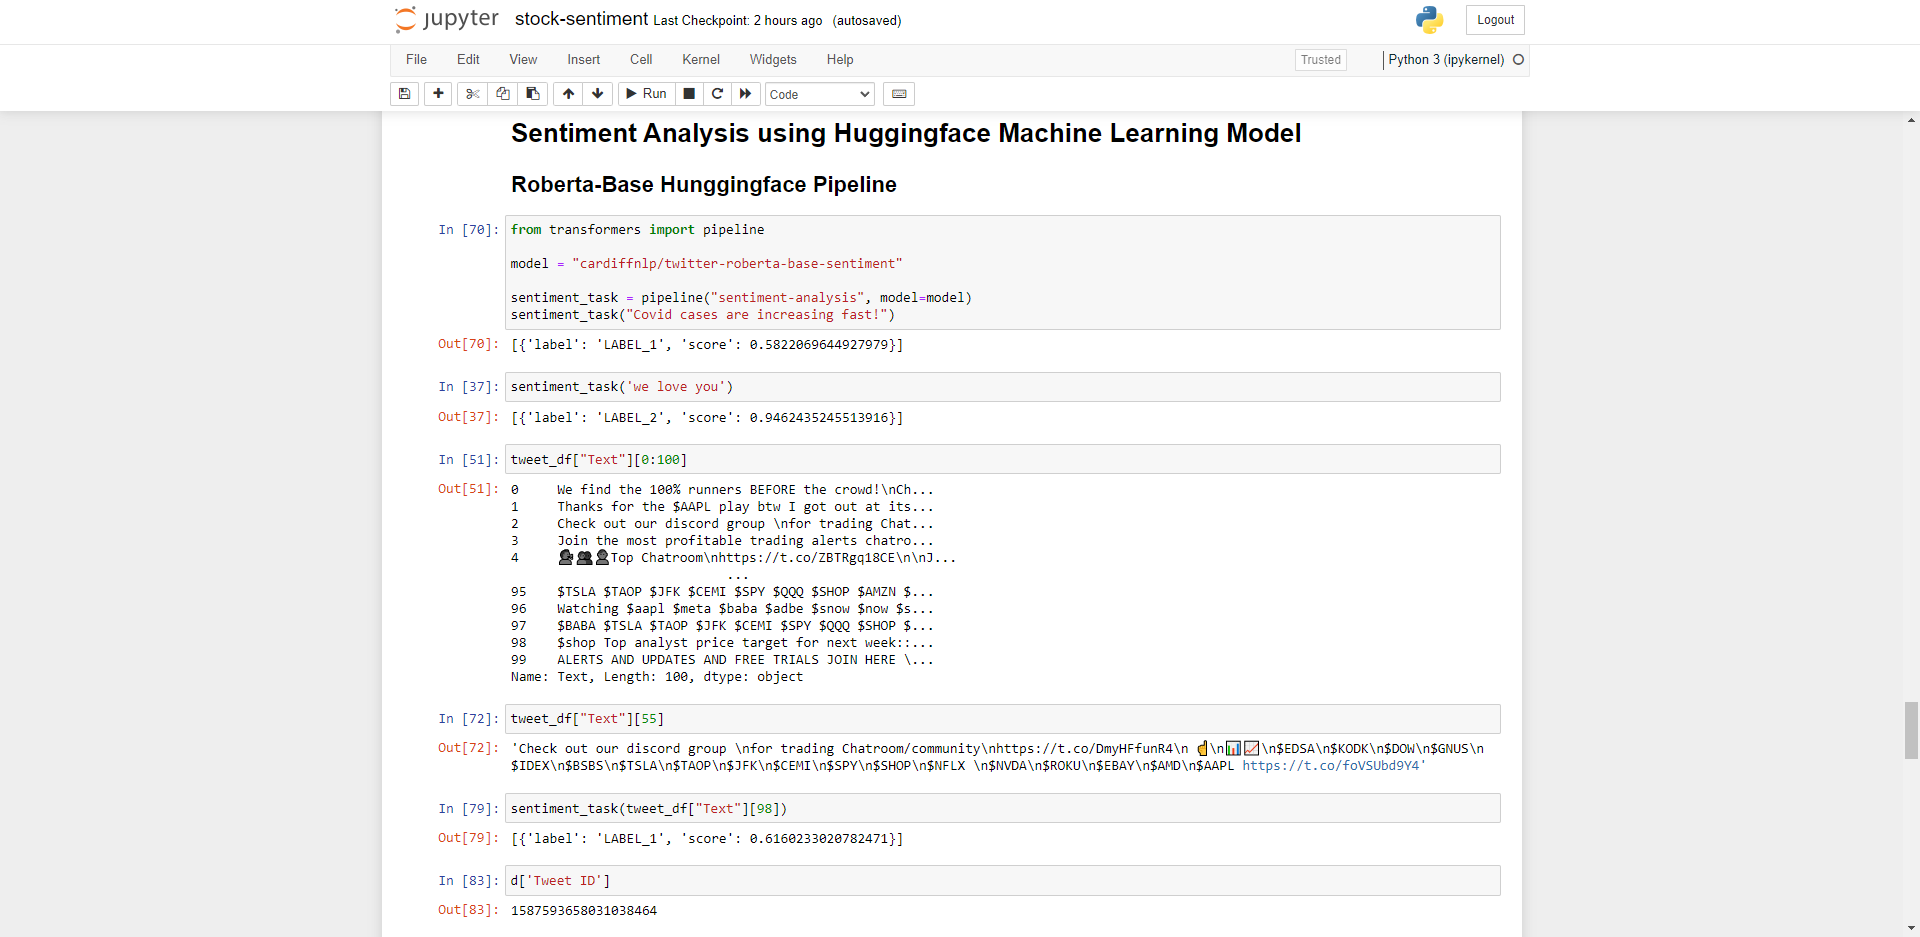
Sentiment Analysis
Now we have some data, let’s prep for Sentiment Analysis using Huggingface’s Machine Learning Pipeline (Transformers).
To get started with transformers head over to: https://huggingface.co/docs/transformers/installation
You will need a deep learning library before installing such as Pytorch or Tensorflow if you want to use GPU for running the sentiment analysis.
Firstly import the transformers machine learning pipeline and run a test analysis to verify the sentiment is calculating correctly. As seen above “Covid cases are increasing fast” gives back a sentiment of 0.58 which equates to negative sentiment, as oppose to “we love you” which scores 0.94 or highly positive sentiment.
Next we run sentiment on a random tweet from our Pandas Dataframe to confirm it works on our dataset.
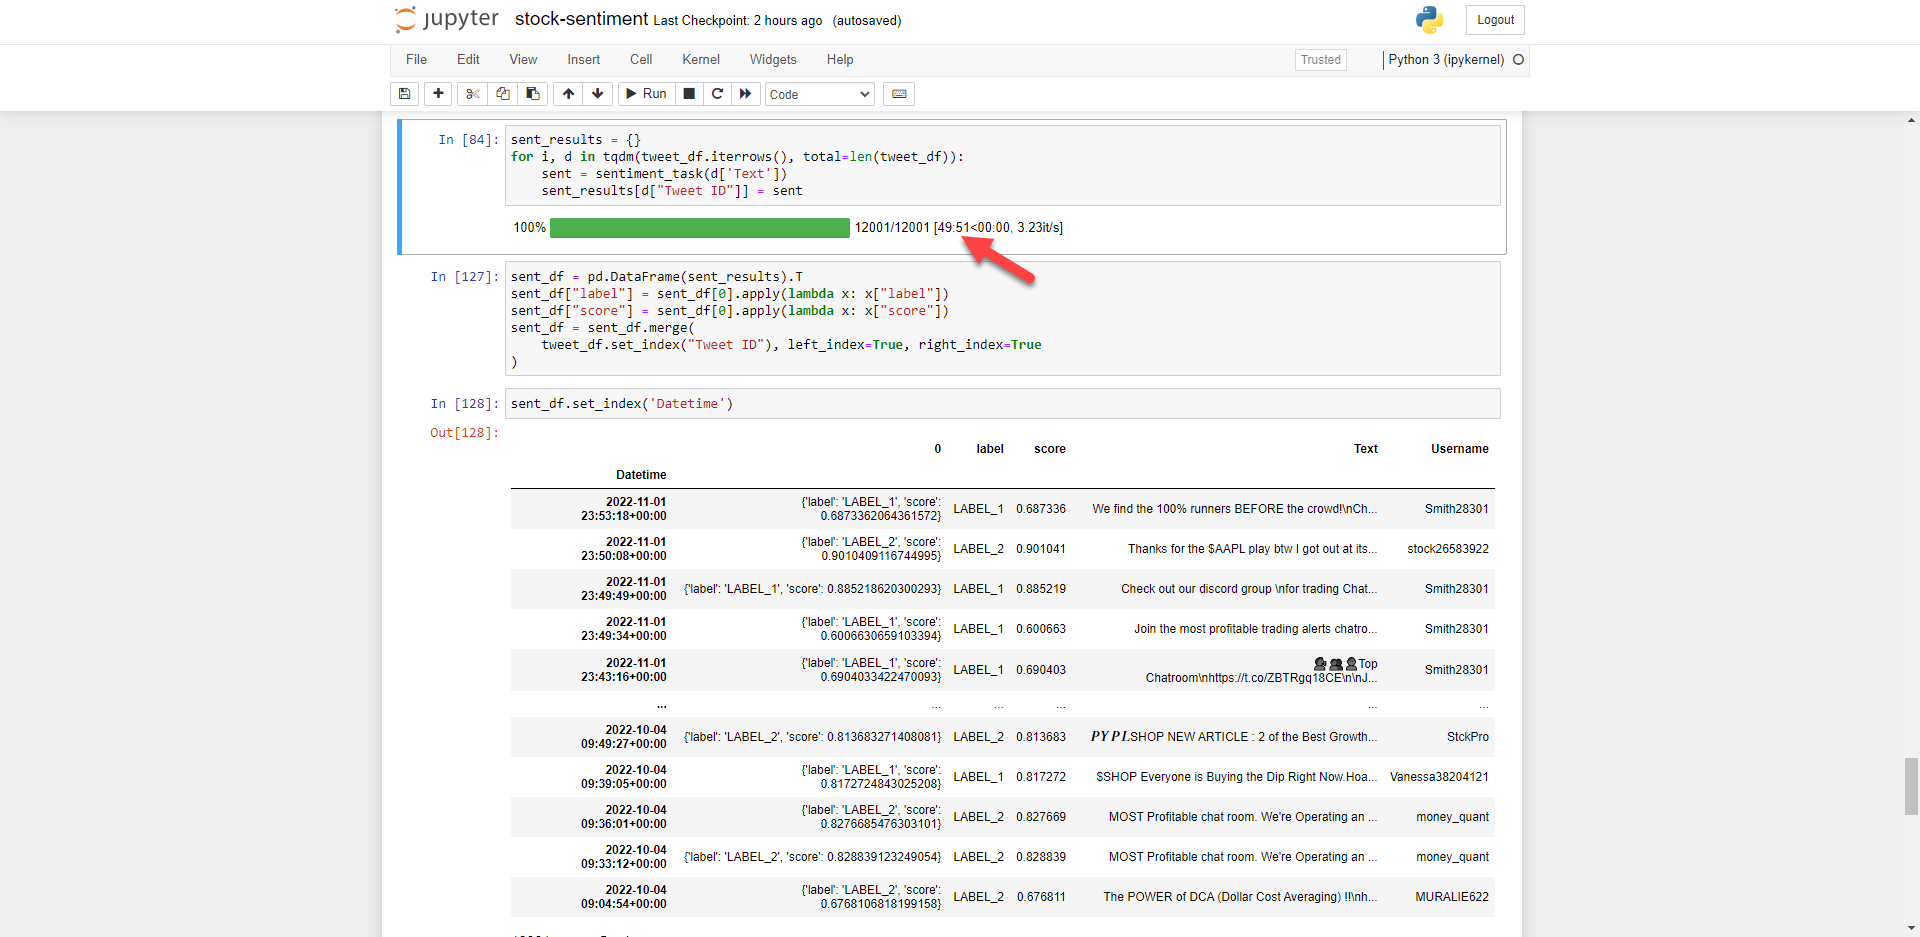
Here we’ll iterate through the tweets in the Pandas Dataframe to get sentiment for each row and give each stock tweet a sentiment score stored in a Dictionary. As you can see, this takes some time to process even on a small amount of data (12,000 rows). If you have a modern GPU this will be much faster, or utilise cloud computing such as Google Collab for analysing larger data sets.
Note: iterations are not always best practice for data structures with respect to time complexity, which isn’t optimised for the purpose of this demonstration.
In the sent_df Dataframe we can see the column score gives a sentiment score to each row. The label correlates to Positive/Neutral/Negative sentiment of the stock which can easily be renamed using a dataframe replace function eg:
df.replace('LABEL_0', 'NEGATIVE', inplace=True)
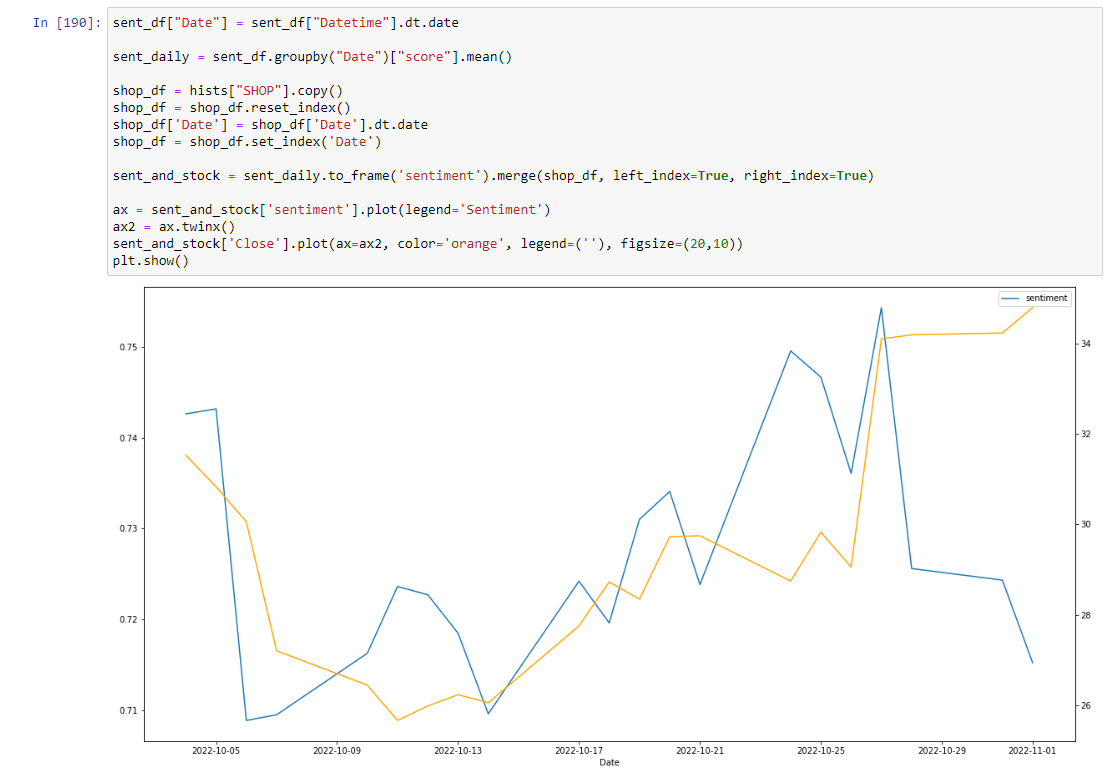
Plotting Sentiment vs. Stock Price
As we can see, there appears to be some correlation between stock price and social sentiment (with respect to Shopify share price) however we’d need to perform this analysis across a much larger time frame and perhaps across other Social Media platforms to get a more definitive result as to whether the sentiment is predictive or reactive to the stock price.